"Facts are stubborn things, but statistics are pliable." -Mark Twain.
No matter what grade you become or how many exercise books you’ve finished, all math students will return to statistics, the science of collecting, analysing, presenting and interpreting data. Here, I’ll be reflecting on a statistics question mainly concerned about cumulative frequency, the cumulative frequency graph and measures of central tendency by way of doing and explaining how I solve an IGCSE question, specifically from the May/June Session of 2005 Paper 4 Question 7 and give a few real-life applications of statistics.
IGCSE Example Question
A common statistics question in the IGCSE is like the following:
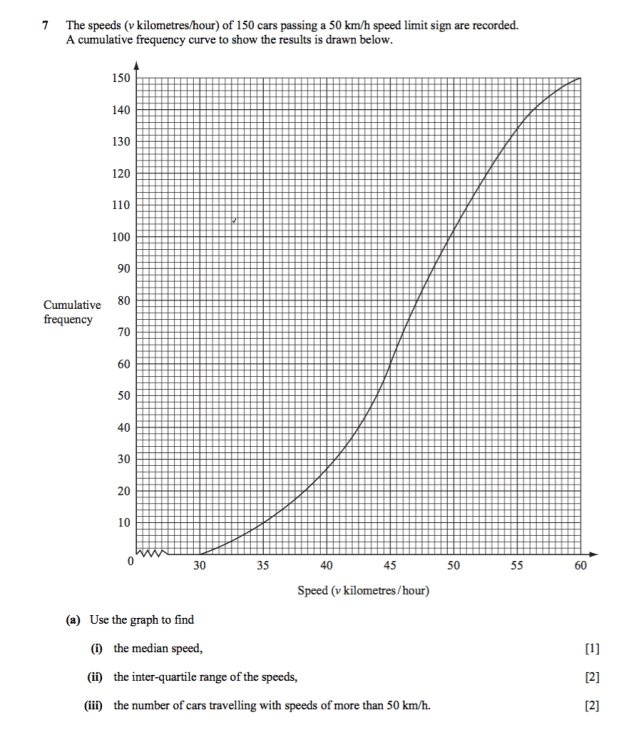
As we can see, the question gives one variable, the speeds of 150 cars in v kilometers/hour and the cumulative frequency in a graph.
For (a)i), to find the median speed using the graph given, or the 50th percentile, we simply have to use the 1/2(n) or 1/2(n+1) formula (because 50/100(n) can be simplified to 1/2(n). Since 150 is already an even number, let’s save ourselves the trouble of a decimal number and just use 1/2(n).
So, 1/2(150)=75. 75 here doesn’t mean that the median speed is 65, but rather the place of the median speed is 75th in the cumulative frequency. So, we look at the y-axis and find the 75th place, which is roughly 46.5 km/h.
Next, for (a)ii), we need to consult the formula to find the interquartile range. IQR=Upper quartile – Lower quartile. The upper quartile is the 75th percentile of the data and the lower quartile is the 25th percentile. Therefore, we can use the formula above once again, though with a little tweaking. Since this time we’re finding the 75th and 25th percentile, we should put in 3/4(n) and 1/4(n) respectively (simplifications of 75/100 and 25/100 respectively).
Therefore, the place of the 75th percentile is 112.5th and the place of the 25th percentile is 37.5th. When we get places of decimal numbers like these, we have to take values of the place before it and the place after it and divide the sum by two. For example, for the 75th percentile, 112.5th place, we have to take the (112th + 113th)/2. This would be (51.5 + 52)/2=51.75. So the UQ is 51.75
As for the LQ, it would be (37th+38th)/2, which is (42+42.5)/2=42.25. So the LQ is 42.25
We can now insert these values into the IQR equation, which becomes IQR=51.75-42.25=9.5.
Finally, for (a)iii), the questions is asking for the number of cars that travel with speeds more than 50 km/h. This means that we must subtract the total number of cars with those that have speeds of and below 50 km/h since the question is king for speeds of more than 50 km/h, not less than (if it did it would’ve been just fine to find the cumulative frequency of cars through the graph by looking at the x-axis’s 50 and seeing the corresponding y value for that).
So, we know the total number of cars is 150. The number of cars that go below 50 km/h we need to find using the graph. It’s 112. So, we just have to do 150-102=48.
These are the next subquestions. For (b)i), we need to find the cumulative, not cumulative frequency, of the number of cars in each of the classes given. This can be done by, once again, looking at the graph. There are 134 cars driving at a speed of 55km/h while there are 102 that drive at a speed of less than 50 km/h. Therefore to find n, we do 134-102=32.
For (b)ii), to find the mean speed of the cars, we must find the midpoint of the classes in the table. Since this is a question with large data, not single data like 1 4 66 91, then we don’t need to mind the sign. We just add the minimum and maximum value of each class and divide it by 2. So for 30<v<=35, it’s (30+35)/2, which is 32.5. We repeat this process for all the other classes.
| Speed (v km/h) | 30<v<=35 | 35<v<=40 | 40<v<=45 | 45<v<=50 | 50<v<=55 | 55<v<=60 |
| Frequency | 10 | 17 | 33 | 42 | n=32 | 16 |
| Midpoint | 32.5 | 37.5 | 42.5 | 47.5 | 52.5 | 57.5 |
Source: Made by me
We then get the table above. Then, we multiply all the frequencies with its class’ corresponding midpoint, add all the values up and divide them by the total number of cars.
So it’s (32.5×10 + 37.5×17 + 42.5×33 + 47.5×42 + 52.5×32 + 57.5×16)/150, which is 6960/150=46.4.
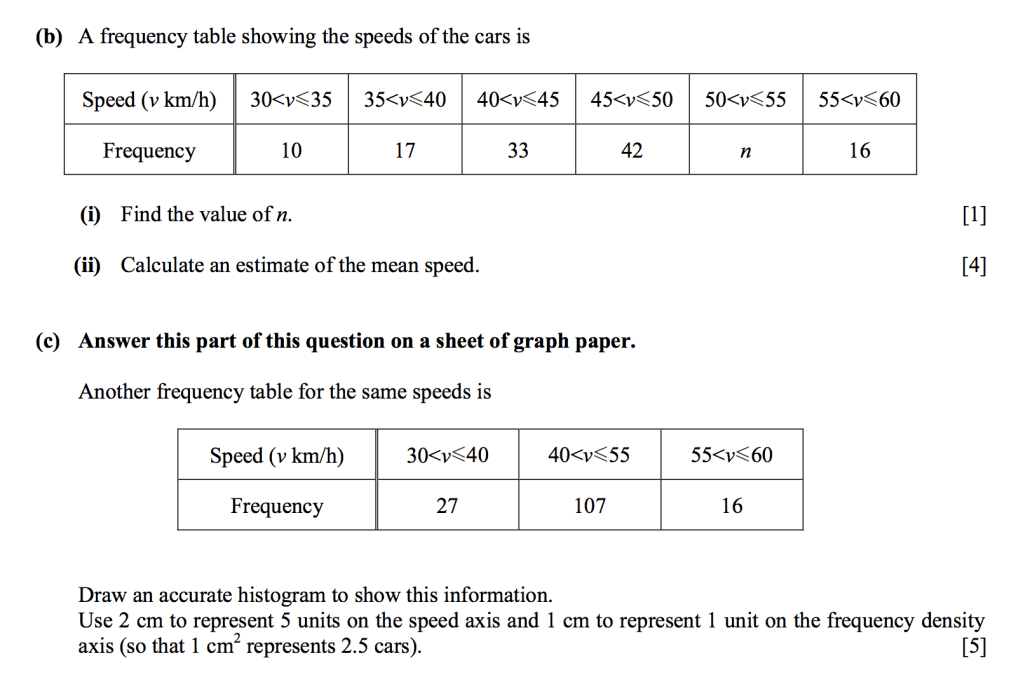
For (c), we need to make a histogram with the values given in the table. However, for this, we can’t just use the frequency as the y-axis. For histograms, we need to use frequency density, which is basically the frequency/class width (maximum value of class – minimum value). So if it’s for class 30<v<=40, we’d have to do 27/(40-30)=2.7. Again, no need to mind the signs for class width.
| Speed (v km/h) | 30<v<=40 | 40<v<=55 | 55<v<=60 |
| Frequency | 27 | 107 | 16 |
| Class Width | 10 | 15 | 5 |
| Frequency Density | 2.7 | ~7.13 | 3.2 |
Source: Made by me
The resulting class widths and frequency densities will be like the above. Finally, we make the histogram making 2 cm for 5 units on the speed axis (x-axis) and 1 cm to represent 1 unit on the frequency density axis (y-axis); following the instructions of the question. The resulting histogram should be like this:
Real-Life Applications of Statistics
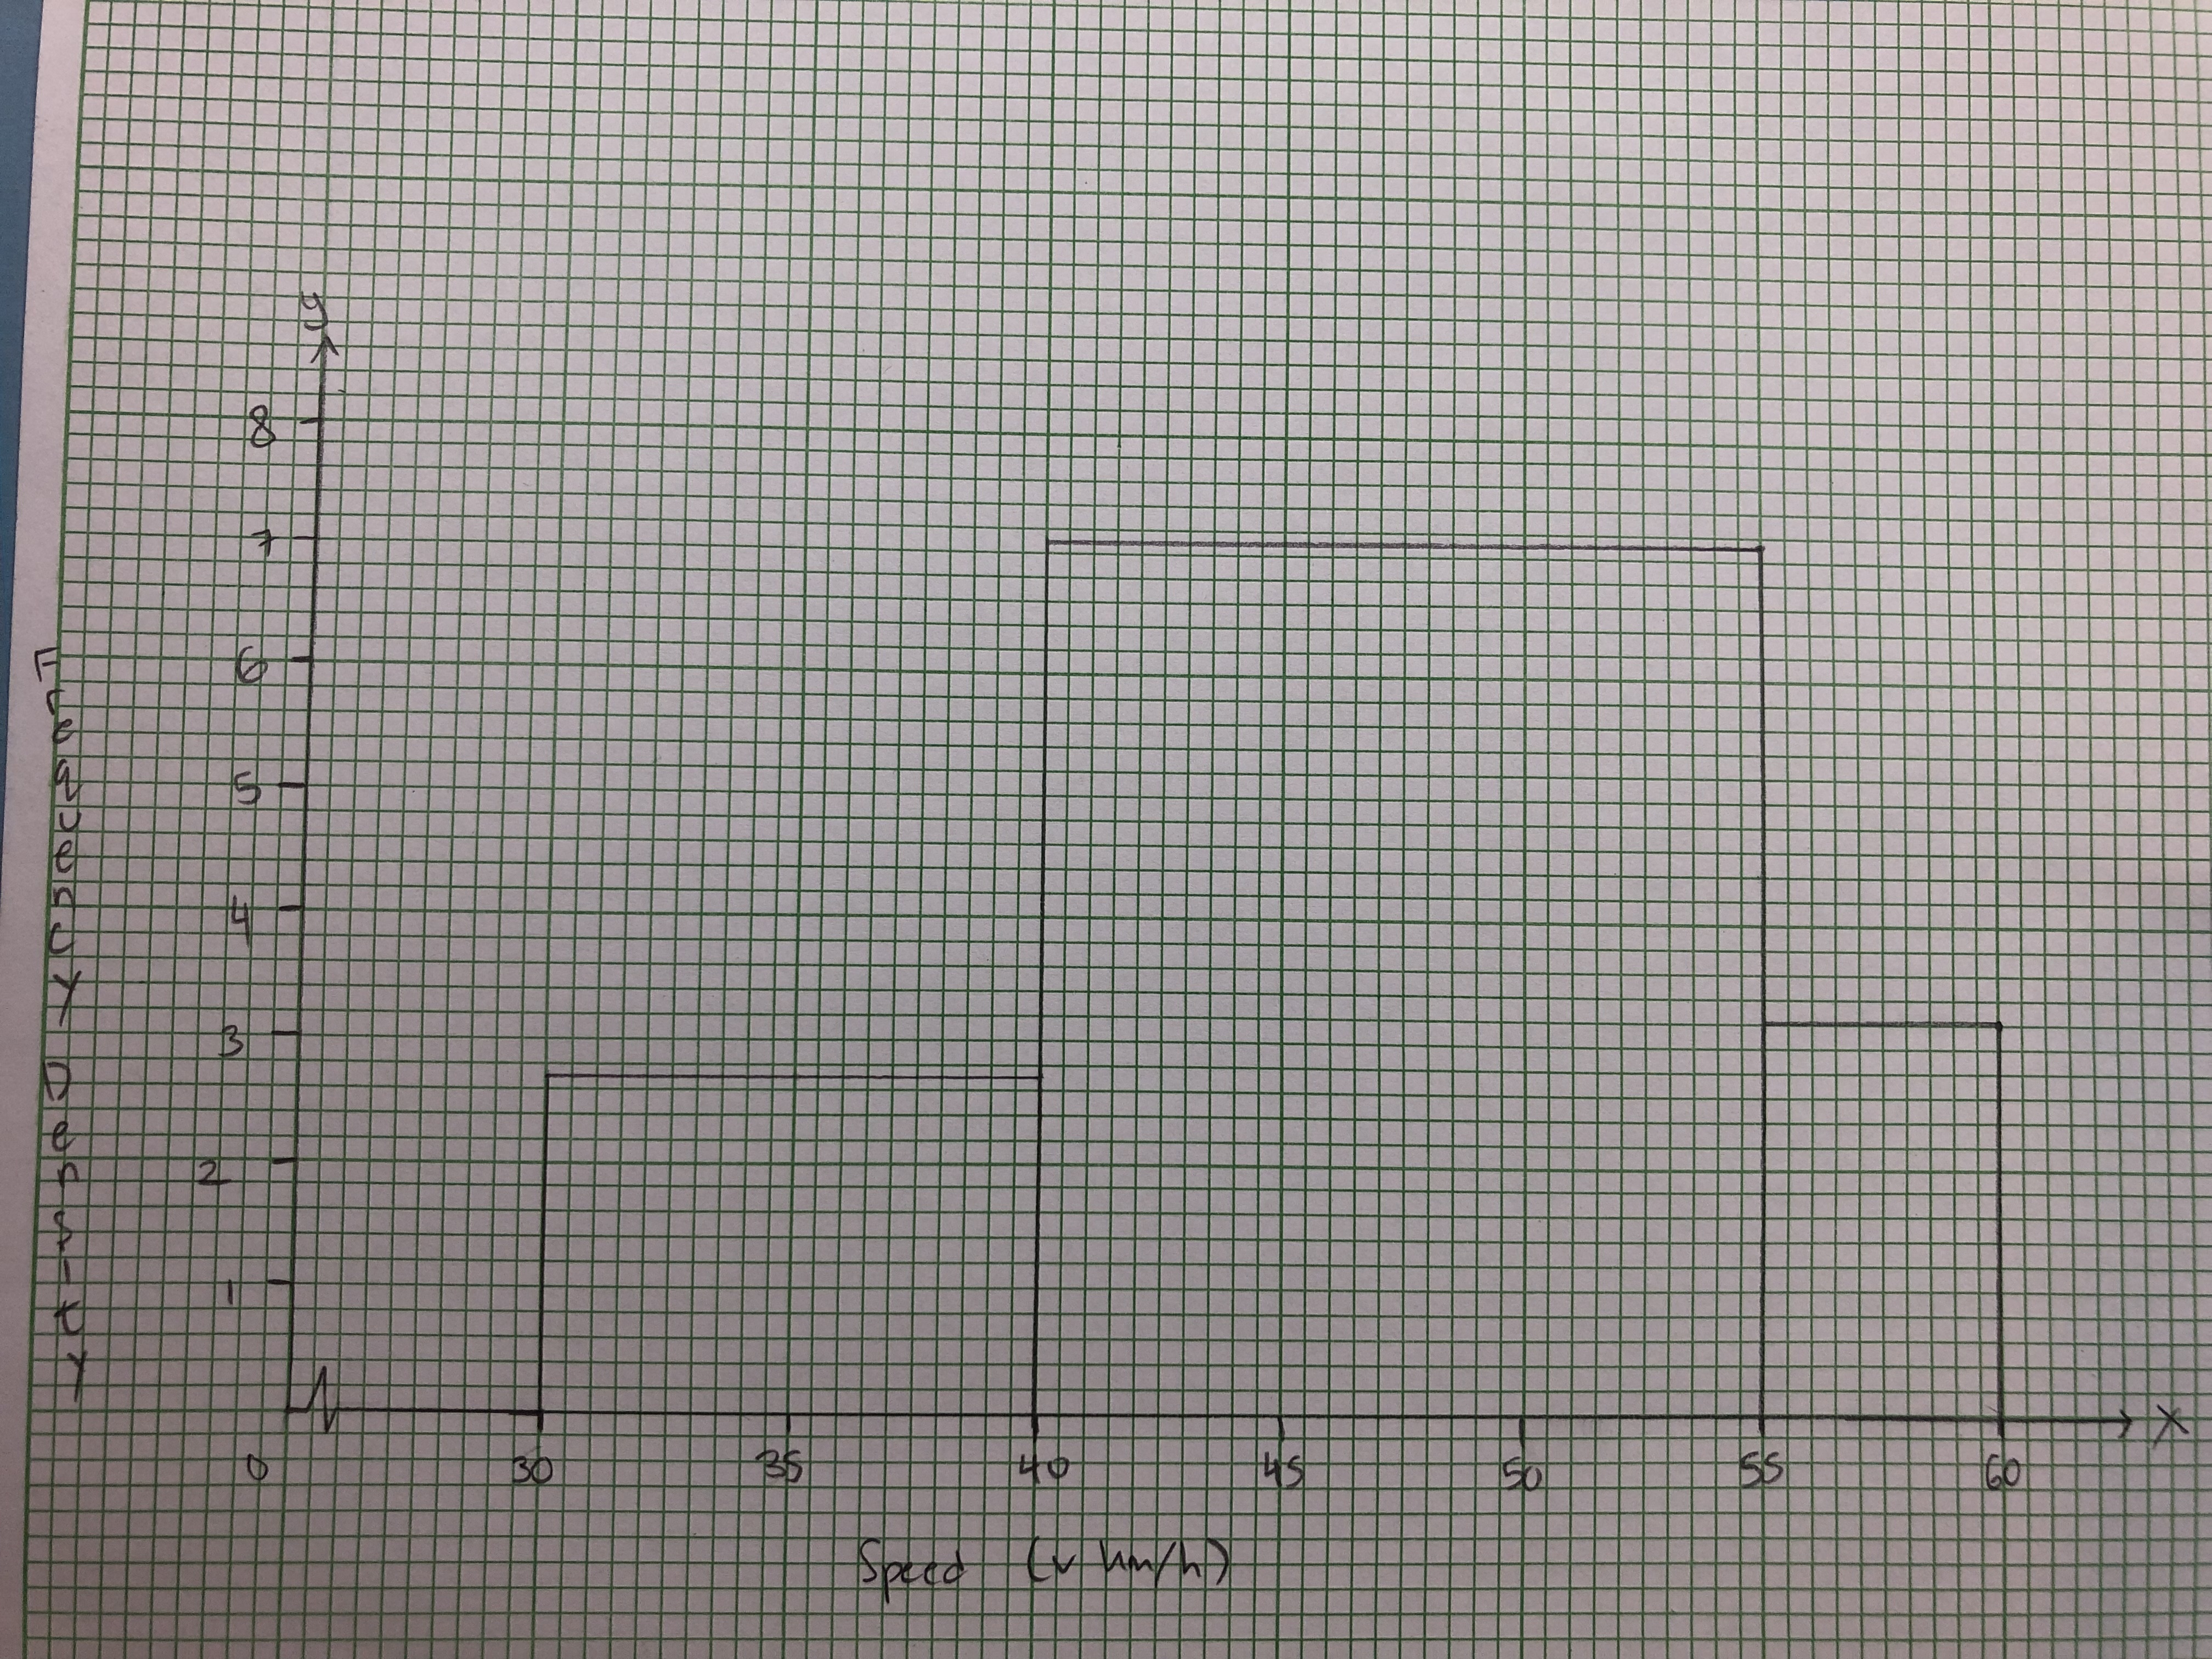
How do you think weathermen tell you the weather forecast. Do they pick out a random slip of paper with a random weather Hunger-Games style? Do they open up a fortune cookie from the nearby Chinese Take-Out place? Did God tell them? Well, no. The weather forecast is partly based on computer models that use statistics. That’s right, lots and lots of data is compared to previous weather data to predict if there’ll be a flood or not tomorrow.
Another application of statistics in real life is in medical studies, or more technically, medical statistics. Medical papers use a range of statistics to prove their point. If there weren’t reliable numbers, we could well be consuming poisonous silver nitrate instead of proper drugs that can cure us of illness. Indeed, if doctors didn’t learn how to make histograms properly, the world mortality rate might be a lot, lot lower than it is now.

As you’ve read for yourself, statistics are a very incredible thing, though still a bit of an irritating and time-consuming question to do in the IGCSE. Thank you for taking the time to read this journal entry of mine and I hope you close this page with a better understanding of how to approach a statistics question when, inevitably, IGCSE looms around your corner.
-T. Isabella
